Airdrie Market Update | November 2025
- Nov 13, 2025
- 6 min read
Click the thumbnail photo below to watch the full market update video ⬇️⬇️⬇️

MARKET STATISTICS OVERVIEW

Overall in Airdrie We had 250 new listings in October, 136 sales, and we had 535 active listings on the market to start November with. Now that means we had sales stay fairly in line from September to October, which is a very typical thing to see, and we also a saw new listings go down a bit which is also pretty typical for this time of year.
And That gives us a months of supply sitting at 3.93 months. Which technically puts us in an overall balanced market here in Airdrie, but right on the cusp of a buyers market of 4 months of supply. Now last month we were over 4 months of supply, but I wouldn’t rush to soon to say that our market is picking up a bunch, the stat I go over at the end will show how this months of supply can be slightly skewed.
Now let’s take a look at that average days on market. Last month this was at 45 days on average, and this month that’s jumped all the way up to 56 days! Keep in mind this is an overall for the whole city, so when we break down the housing types you’ll see how this better relates to the different styles of properties.
And lastly let’s look at the pricing. The benchmark price across all property types is now $520,400,which is down about 1.1% from October, and down about 6% from our peak in June 2024
Alright well thats the overall numbers, Now let’s break things down by housing type,
because each segment is always behaving just a little bit differently.

And Starting with detached homes, we had 78 sales in October, and 139 New listings. This is basically the same number of sales for the past 3 months now, but the new listings is dropping off a bit now as we get closer to the winter. Now that left us with our active inventory is sitting at 304 homes for sale, bringing us to 3.9 months of supply. So after a couple months of being in that buyer’s market range, we see detached homes also move into the balanced marked range again.
Though we did see a jump here in the average days on market as well, which is now up to 55 days. And The benchmark price for detached homes is currently $619,600, down about 1.2 percent from last month, and now down about 6% from the high we saw in June 2024. For context, a detached home around $600,000 would be worth about $36,000 less today than it was last spring.

Next up, we have our semi-detached homes, or duplexes. We saw 7 sales last month, and 26 new listings, which gave us an inventory of 52 semi detached homes to start October with.
And That gives us 7.43 months of supply, which puts this segment definitely in a buyers market right now.
As for pricing, the benchmark price is currently $486,300, which is a 1.2% dip from October, and now sitting just over 5% below the peak prices we saw in April of this year. Again for semi detached homes we saw a big jump in average days on market, but this one is much bigger than the rest. Of those 7 properties that sold in October, the average days on market was 105 days.

Alright, Now let’s move onto row homes. We had 41 sales in October, And 67 new listings last month, which is actually a pretty good jump in sales from September, and brought down the inventory and months of supply. That gave us 145 active listings to start the month with And That puts us at 3.24 months of supply.
And right now townhouses have a benchmark price of $374,600, down a half a percent month-over-month, and down about 5% from the peak townhouse prices we saw in September 2024.

And finally, lets take a look at our condos here in the city. We had 10 sales, 18 new listings,
and 46 active listings at the start of October. That gives us 4.6 months of supply, and with a benchmark price of $286,400, That’s down 2.3% in just the last month, and now down 6% from the peak prices we saw in October 2024.
Alright well now lets take a look at the price ranges, an we’re going to look at these ranges the same way we’ve done the last couple months, and thats by looking at the months of supply in each range, which gives us a good idea of the supply and demand in every range.
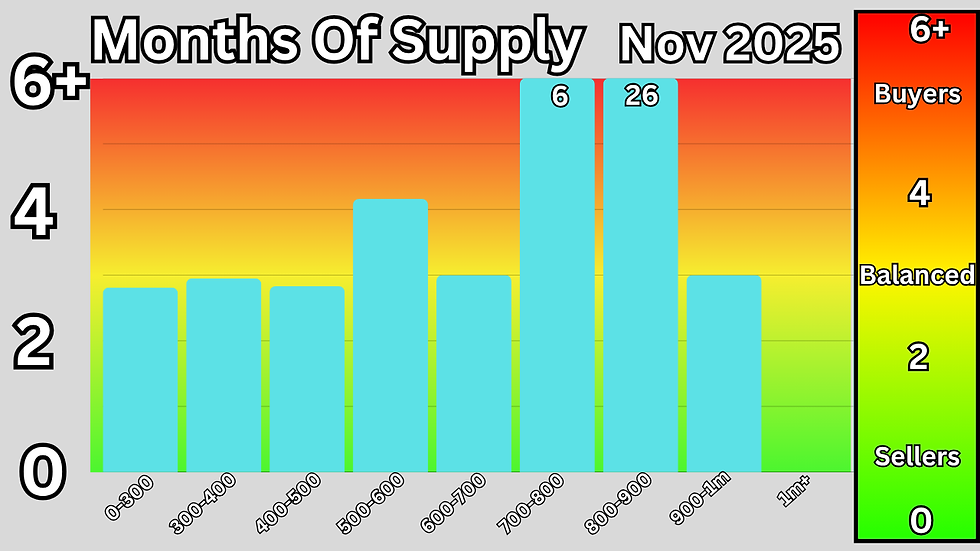
Starting first with the 0-300 range, here we had 16 sales in October, and we currently have 45 active listings. That gives us a months of supply of 2.81 months.
Now looking at the 300-400 range, here we had 20 sales last month, and we currently have 59 active listings. That gives this range 2.95 months of supply.
Moving onto the 400-500 range, here we had 24 sales in September, and right now we have 68 active listings, which gives us 2.83 months of supply.
Now onto the 500-600 range, we had 32 sales last month, and right now we have 133 active listings, giving us 4.16 months of supply,
And moving up to the 600-700 range, here we had 34 sales last month, and we currently have 102 active listings, giving us 3 months of supply.
Now lets look at the 700-800 range. Here we had 9 sales in September, and we currently have 54 active listings. Giving this range 6 months of supply,
Moving up to the 800-900 range, we saw just 1 sales in October, and we currently have 26 active listings. Now this gives us technically 26 months of supply here since there was only that one sale. So definitely hoping we see a few more sales in this range this month.
And now looking at the 900-1m range. We had 3 sales in October, and we currently have 9 active listings, which gives us 3 months of supply, and puts this range in a balanced market for the first time in a while.
And lastly lets take a look at the $1m and up range. Here we had 2 sales in October, and we currently have 18 active listings, which gives us 9 months of supply.
So this actually looks a bit better than last month, where we only had 2 price ranges left that were not in buyers markets, vs this month where we see 5 price ranges that are sitting in balanced market territory.
But I wanted to show you this one chart at the end. Now this chart below is showing our number of monthly sales here in 2025 in the blue, and the number of expired listings that came off the market without a sale in red.
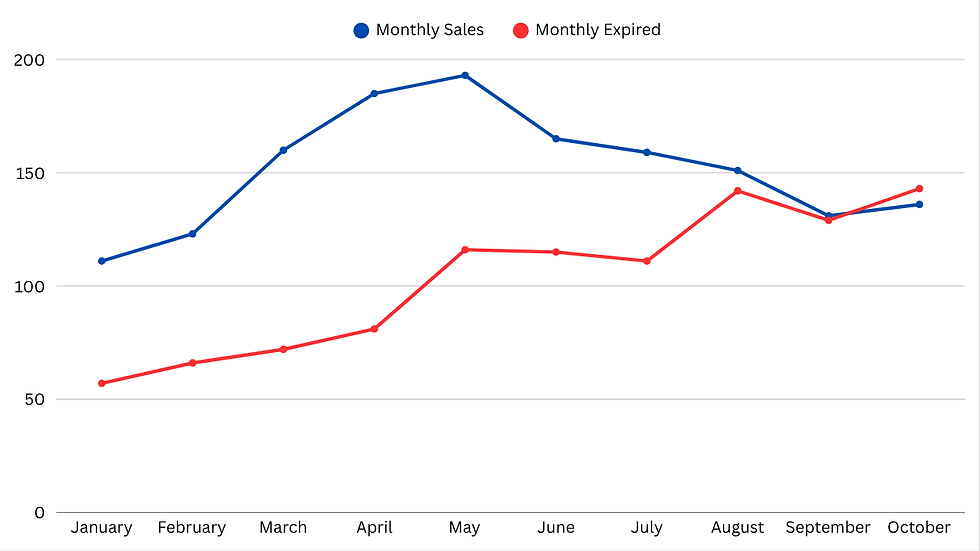
So this essentially represents every single listing that came off the market each month this year.
You can see at the beginning of the year, about 2 thirds of the listings coming off the market were due to getting a sale, and about 1 third of listings were expiring or being terminated and pulled off the market without a sale.
As the year has gone on those lines have started to get a bit closer to each other until October where we saw them cross for the first time. This means that last month we saw more houses come off the market without a sale, than with a sale.
And this is where that months of supply can be a bit of a skewed number. For example this months we see a lot of areas on paper look like they moved slightly back into a balanced market, but when you factor in that half those listings exited the market without a sale, you can see that it’s really much more a buyers market than the stats even show.
So right now, if you’re thinking about making a purchase in our market, it may be a good time to do it this winter. Prices have come down quite a bit, interest rates are doing down, and if you go on a variable rate mortgage you’ll likely be able to ride them down a bit more.
And with our inventory starting to decrease into the winter, right now you have the most selection available. As we get into next spring there’s a reasonable chance that inventory is lower and we see prices make a seasonal uptick.
So if you’re a buyer, now might be your time to swoop in.
Now slightly different story for you sellers. Right now if you’re considering selling, I probably wouldn’t unless you really do need to sell. The current conditions just aren’t very favourable to sellers.
And if you do need to sell right now heading into the late fall and winter, you’re going to have to price fairly aggressively to attract the buyers to your listing over others in the area.
If you want to know how much homes are selling for in a specific neighbourhood, I provide a FREE monthly market report sent out by email. Click the button below to go fill out my market update request form!

Check out my YouTube video below where I go over everything in this blog post and subscribe to my channel if you want to see more Airdrie related content!
- Brad Walker
Comments